
How the NHL Schedule Impacts a Teams’ Chances to Win a Game
When talking about a teams’ odds to win a game, a lot of emphasis is typically placed on the quantitative stats, such as goals, special teams, save percentage, etc. However, unlike in a video game simulation engine, NHL players are real people who feel real impacts from real life life events. In addition to quantitative stats, qualitative factors also play an important role in a teams’ odds to win a game, with one of the most notable factors being the travel schedule. It is not difficult to imagine how a team jumping on a plane right after playing a game, only to play another game the next day, may be at a disadvantage if their next opponent has had one or more days of rest.
This article will analyze three travel variables; hours off, days off, and distance traveled, which are all factors related to the NHL schedule. This article will first go over these three variables individually, analyzing the numbers since the 2013-2014 season and excluding the shortened 2021 season, and then this article will analyze what these dynamics look like when distance traveled is combined with days off and hours off. The 2013-2014 season was chosen as the cut-off point in order to gather a good sample size, while also keeping in mind how the schedule dynamics changed once the NHL switched to the four division format after the 2013 shortened season.
Days Off
Starting off with the most commonly talked about variable of the three, days off is the most straight forward, which is simply the number of days a team has had off since their last game. Typically teams will have one day off between games, although it’s also common to see teams play on back-to-back days, or see teams have two days off. There are also instances where teams will have three or more days off between games, although this only happens occasionally throughout a season. Since 2013-2014, teams with more days off, and in turn more rest, won 54.0% of the time.
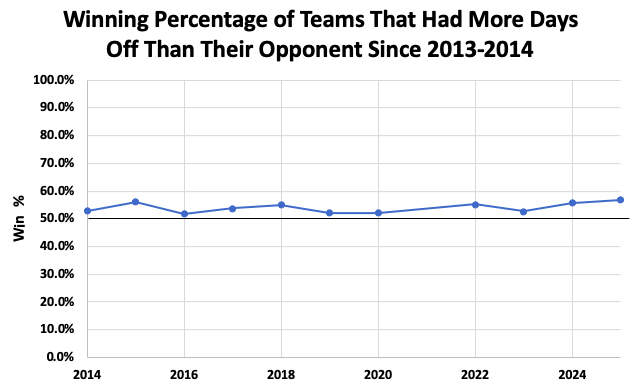
54.0% win rate for teams with more days off since their last game compared to their opponent
Surprisingly, the degree to how rested a team was compared to their opponent did not matter. When a team had just one day of extra rest, that team won 54.2% of the time. When adding an extra day of rest and looking at all occurrences of one team having two extra days of rest over their opponent, the rested team’s winning percentage only increased to 54.4%. For three day rest differences it’s a similar 54.3%; but increasing the rest difference after that actually dropped the winning percentage, likely because a team becomes rusty with too much rest, which is more detrimental than having no rest.
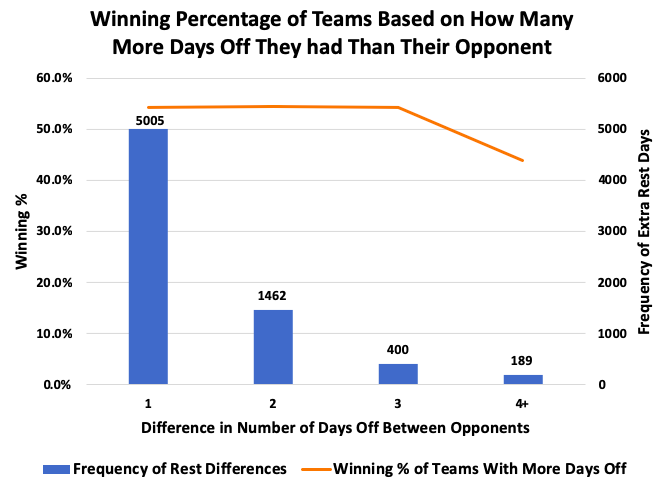
Winning percentage is consistently between 54-55% whether the rested team has 1, 2, or 3 more days of rest than their opponent
However, although the magnitude of rest is not important, what is important is if one team is playing their second game of a back-to-back. For example, if team A has one day off and team B has two days off, their rest differential is one day, but both teams still had the benefit of some rest between games. However, the effects change noticeably if the rest differential is one, but team A had no days off and team B had one day off. Even though the rest differential is the same as the previous example that resulted in a 54.2% win rate, having no rest at all is detrimental, and results in the rested team having a 57.6% win rate. In other words, teams lost 57.6% of games that were played on the second day of a back-to-back, not including games where their opponent was also playing on a back-to-back.
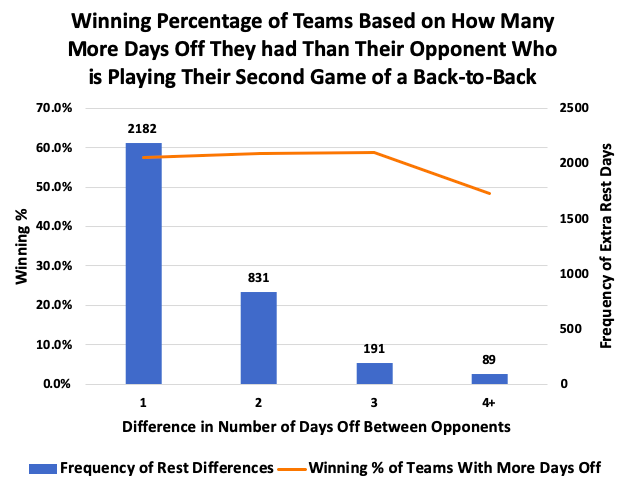
Winning percentage of teams with at least 1 day off against teams playing their second game in 2 days is consistently between 57-59%
However, the biggest flaw in the days off metric is the fact that it is not applicable to nearly half of all games played since 2013-2014. Of the 13,792 game played, excluding the 2021 shortened season, there were 7,056 instances where one team had more rest than another, while 6,736 times both teams had the same amount of days off. In more understandable terms, in only 51.2% of games could this day off factor even be applied, since in 48.8% of games, both teams had the same number of days off. This is where a similar metric that reduces this issue comes in; hours off.
Hours Off
Hours off has the exact same premise as days off, but it is more specific in that it also considers the time of day that a team started their previous game. For example, if team A played on Saturday at 3:00pm EST and team B played on Saturday at 7:00pm EST, and then the two met the next day on Sunday at 7:00pm EST, both teams would have the same number of days off, but team A would have four extra hours off. In theory, hours off could be significant for this specific scenario where two teams are playing on back-to-back days and the few extra hours of rest for one team makes a noticeable difference. However, this only has a slight effect, as when two teams meet on a back to back, the team with more hours off wins 52.0% of the time.
Aside from this back-to-back game scenario, teams with more hours off had a slightly worse winning percentage compared to teams with more days off, with rested teams at the hours level winning 52.8% of the time.
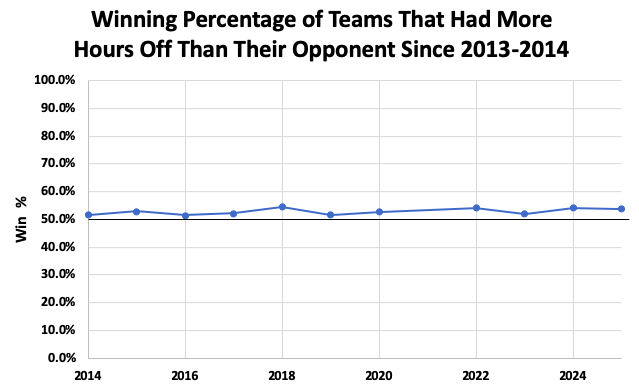
52.8% win rate for teams with more hours off since their last game compared to their opponent
This isn’t surprising, as all games where one team had more days off is automatically applied here; but in addition, the hours off metric includes games where teams had the same amount of days off, but one team had extra hours off. Even though the hours off metric captures more data, with only 17.5% of games being inapplicable due to two teams having the exact same amount of hours off, it is actually a less meaningful metric than days off. This is because when applying hours off to teams who had one or more days off, a few extra hours difference no longer has a significant impact, and as a result the additional games captured by hours off has significantly more “randomness” in terms of the outcomes related to the rest variable. In other words, days off does a good job at accounting for rest, while conveniently disregarding games where two teams did not have a significant difference in rest. On the other hand, hours off captures extra “noise” which is not necessarily useful, as for example, a team with 50 hours of rest versus a team with 48 hours of rest is negligible.
Rest on its own is very intuitive; players who have an extra day or so of rest over their opponent have the advantage because they can better recover from a previous game. However, one more piece of the puzzle is the quality of rest, and that can be measured by distance traveled between games.
Distance Traveled
The last variable is distance traveled between games, where all distances were found by taking the data from this website that calculated distances from each NHL arena, cleaning up the formatting in SQL, adding the Arizona Coyotes’ distance combinations to the data table for past seasons using the same principles, and then calculating the distance every team traveled heading into each game since 2013-2014. Teams that played consecutive games in the same city were given zero travel distance. Since 2013-2014, teams that traveled less than their opponent, whether that meant not needing to travel at all or simply traveling less distance, won 51.7% of the time, which is a slightly lower win rate than the days off and hours off variables.
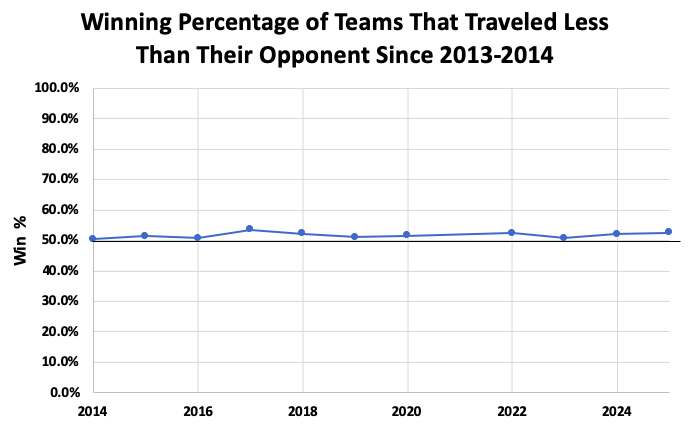
51.7% win rate for teams with less distance traveled since their last game compared to their opponent
In only 3.6% of games did both teams travel the same distance, and this is typically in back-to-back situations where two teams play each other in consecutive games, or when both teams play their first game of the season, since the logical assumption is that teams are already in the city ahead of time before the season starts. However, if two teams needed to travel into the same city before a game, distance traveled would only be meaningful if one team had to travel significantly further. If one team traveled 600 kilometers and their opponent traveled 800 kilometers, then the distance traveled wouldn’t make a significant difference in reality.
When accounting for this and only analyzing instances where one team didn’t need to travel and the other team did, the win rate improved to 54.3% for the non-traveling team. This is in line with what we would expect, although home ice advantage is a confounding variable here, as not needing to travel automatically means the non-traveling team is also playing consecutive games at home, and as discussed in a previous article here, teams have won 54.6% of home games in the salary cap era, and 54.2% of the time from the time period analyzed in this article, 2013-2025.
As a result of having stronger confounders and simply having a worse win rate, distance traveled is the weakest of the three schedule variables on its own. However, both days off and hours off can be paired with distance traveled for an improved understanding of how these factors affect the players.
Days Off & Distance Traveled
By looking at both days off and distance traveled simultaneously, we can easier visualize the effects of these real life factors. Below is a matrix that shows the nine different possibilities of teams entering a game, where both days off and distance traveled are either more, equal, or the same as their opponent.
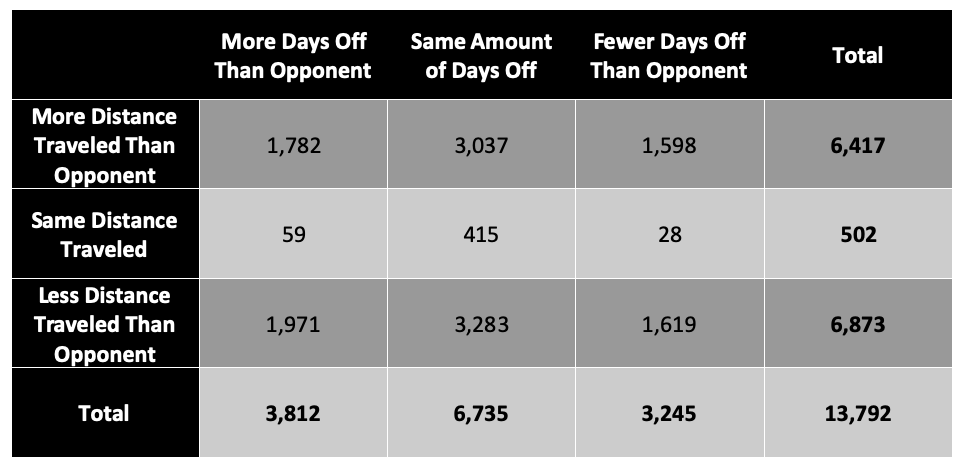
Number of games won in each scenario of days off combined with distance traveled
As seen, teams are more successful when combining both variables in the optimal direction. Each “pair” is opposite to one another diagonally, where for example, the win rate of teams with more days off and less distance traveled is 55.2% (1,971/(1,971+1,598)). Applying this formula the other way, the win rate of teams with more days off and more distance traveled is 52.4% compared to its opposite of fewer days off and less distance traveled, which is 47.6%. These two variables are also correlated in some instances, where for example, when teams are on road trips, they are always traveling some distance from game to game, and more likely to play games on a tighter schedule than teams on a home stand, who simultaneously do not need to travel.
The cell “Same Distance Traveled” and “Same Amount of Days Off” are almost exclusively represented by pairs of teams who played each other in back-to-back games, while either cell to the left or right, which shows the same distance traveled but a discrepancy in time off, is most often seen at the start of the season where one team who has already played a game plays another team in their first game of the season. Similar results are seen with the matrix of hours off and distance traveled.
Hours Off & Distance Traveled
As shown in the matrix below, the same trends are represented by the hours off and distance traveled matrix, where having more hours off and less distance traveled results in the highest win rate of 54.3%, while having more hours off and more distance traveled results in a win rate of 51.0%.

Number of games won in each scenario of hours off combined with distance traveled
Because games that fall under the “same distance traveled” row are either back-to-back games with the same opponent or the first game of the season for one team but not the other, this row is identical to the “same distance traveled” row in the days off matrix.
These results help show that, while distance traveled can further swing a teams’ advantage in one direction, ultimately days off and hours off are the more significant factors.
Conclusion
After analyzing three different qualitative variables related to the NHL schedule, days off, hours off, and distance traveled, it appears that all three variables have a slightly positive impact on winning percentage when a team has fewer days or hours off, or less distance traveled compared to their opponent. Distance traveled was the most easily applicable due to having the fewest number of equal values between two opponents, while days off could only be applied to slightly over half of NHL games from 2013-2025 due to how often two teams meet with the same number of days off. However, upon excluding instances where teams had an equal value of these three variables, days off had the strongest effect, where teams with more days off won 54.0% of the time, which was further improved to 57.6% of the time when looking at specific instances of rested teams playing teams on their second game of a back-to-back. On the other hand, distance traveled had the weakest effect, with teams traveling less distance to their next game winning just 51.7% of the time, although this win rate improved to 54.3% when only analyzing instances of one team traveling while the other team did not need to travel.
While these win rates may seem low in general, it is important to keep in mind that NHL hockey is one of the most “random” sports, where parity is prominent and a 54.0% win rate from one variable alone is amongst the strongest of any individual variable used to predict game winners. To put it into perspective, teams with home-ice advantage in this same time span have won 54.2% of the time, and when simply looking at which team has a better points percentage, the team with with the better points percentage at the time won 56.6% of games.
As a result, either days off or hours off are strong qualitative variables to consider adding to a prediction model, as these two variables will almost never have strong covariance with other quantitative variables in a given model. Days off has a stronger relationship with winning percentages, but is flawed in that almost half of all games have pairs of teams with identical days off. Contrarily, both hours off and distance traveled do a good job in eliminating this issue of identical values with an opponent, but they do not do as good of a job as days off at isolating the real life schedule factors of rest and fatigue. Hours off specifically accounts for instances where one team may only have a few extra hours off in a multiple day span, which may have a negative effect. As with any statistical model, a balance of accuracy and practicality must be taken into account, and whichever variable is deemed most effective will depend on the context. But whatever the case, what can be concluded is that schedule related variables do have an impact on winning NHL games.