A New Version of Goal Differential in the NHL
Goal differential is a simple, but effective statistic in the NHL that provides a quick snapshot of how dominant a team is and how lopsided their victories typically are. A team like the 2014-2015 Anaheim Ducks finished first in the Western Conference in points with 109, and finished second in the league in wins with 51, but only had a +10 goal differential, which was the lowest of all 16 playoff teams that season, implying that most of their wins were close games (they finished the season with a 33-1-7 record in one-goal games, by far the most impressive record in one-goal games in NHL history). On the other hand, the 2010-2011 New York Rangers and 2010-2011 Chicago Blackhawks had a +35 and +33 goal differential respectively, both finishing 8th in their respective conferences with 44 wins. Despite being a lower seed and winning only slightly more than half of their games, their goal differential implies that they won a handful of lopsided games.
While goal differential is a simple stat and is easy to understand, it is simultaneously a very effective stat, and provides a lot of information despite having a simple formula of goals for minus goals against (Goal Differential = GF - GA). However, there is actually a slightly improved version of goal differential from a statistical standpoint, and this is the goals for to goals against ratio (GF:GA), which is simply calculated by dividing goals for by goals against (GF:GA = GF/GA).
What GF:GA Tells Us
This GF:GA variable is not recognized by the NHL, and is actually a transformed variable used in various Slapshot Bets’ prediction models. While it is very similar to goal differential, there are some subtle differences in what it tells us. GF:GA is simply the average number of goals scored per game for each goal against. This holds the “dominant” factor of goal differential, but also adds an element of accounting for teams that are extremely offensive or extremely defensive, and better displays teams that are dominant in all areas of the game. For example, in the 2006-2007 regular season, both the Buffalo Sabres and Ottawa Senators led the league in goal differential with a +66. The Sabres had scored 308 goals and allowed 242 goals, while the Senators had scored 288 goals but allowed only 222 goals. According to goal differentially, these two teams are equally as dominant. However, the Sabres appear to be a slightly better offensive team, while the Senators appear to be a slightly better defensive team. The GF:GA ratio helps separate these two teams slightly further, where the Senators end up having a better GF:GA of 1.30 (288/222) compared to the Sabres’ 1.27 GF:GA (308/242). Although it’s a completely different scale than goal differential and isn’t as intuitive, the ratio format allows for the same comparisons while also adding in this additional element.
If this transformed stat is still confusing, an easy way to think about it is by using extremes. A team that wins their first game of the season 2-1 has a GF:GA of 2.00, and a goal differential of +1. A team that is part of the way through the season with 100 GF and 99 GA has this same goal differential of +1, but has a far smaller GF:GA of 1.01. Another example is if you have two teams; team A scored 250 goals but allowed only 200 goals, while team B scored 300 goals but allowed 250 goals. These two teams have the same goal differential of +50, but team A has a GF:GA of 1.25, while team B has a GF:GA of 1.20. This implies that team A’s ability to keep additional pucks out of the net is more valuable that team B’s additional goals scored at the cost of allowing the same amount of extra goals against. This is a similar scenario to the 2006-2007 Sabres and Senators mentioned earlier, where the fewer pucks the Senators allowed were deemed to be more valuable in the sense that their net score per game was higher.
How GF:GA is Applied
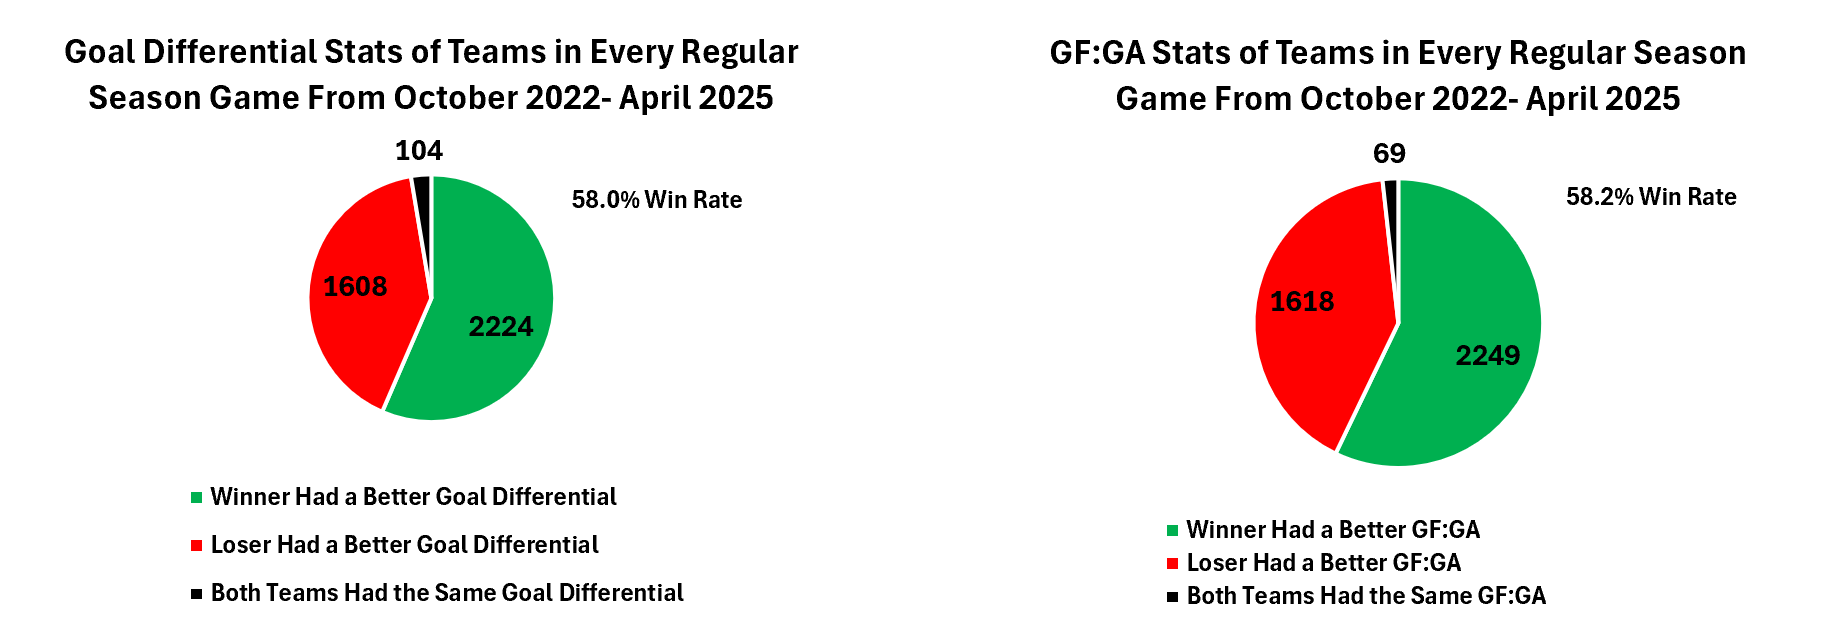
GF:GA is also a more practical statistic to use in real statistical applications. In all 3,936 regular season games played from 2022-2023 to 2024-2025 (1,312 each season), the team that had the better goal differential won 2,224 times and lost 1,608 times, with a remaining 104 games disregarded due to both teams having identical goal differentials (common near the beginning of every season, but can still occasionally occur later in a season). This translates to a 58.0% win rate, not taking any other variables into account. On the other hand, in this same time span, teams that had a better GF:GA won 2,249 times and lost 1,618 times for a slightly better win rate of 58.2%, with a remaining 69 games disregarded due to both teams having identical GF:GA values. However, in this sample, teams with identical GF:GA values almost exclusively came from the beginning of the season, which is partially why this statistic is slightly better. Unless if two teams have the exact same goals for and goals against, they will practically always have a different GF:GA value, even if their values rounded to two decimals appear the same. This added benefit is useful, because in statistical models, it is usually more beneficial to have differing stats between two comparisons.
GF:GA has a better winning % and is omitted less often
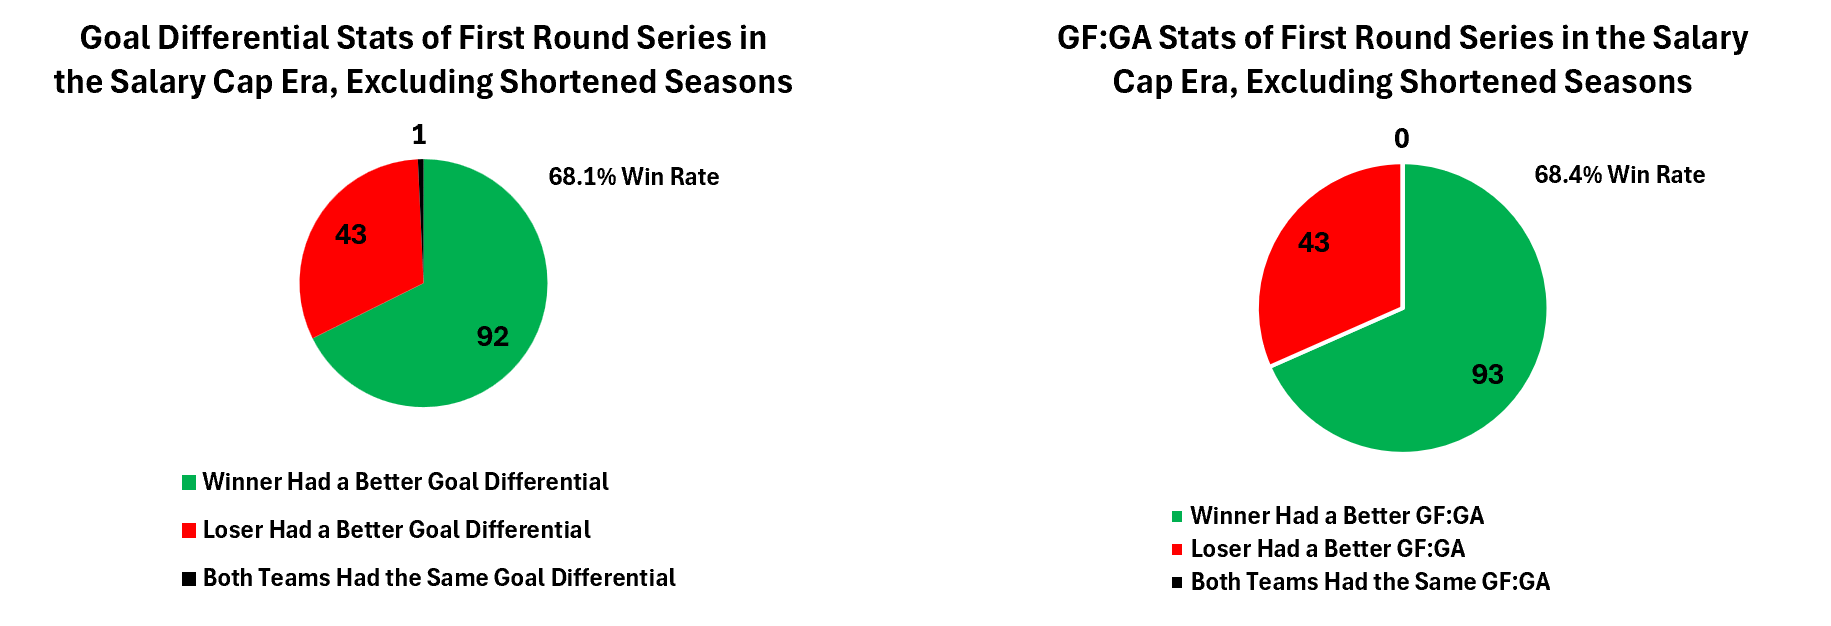
In the post-season, we see a similar result, where first round winners since 2005-2006, while also excluding the 2013, 2019-2020, and 2021 shortened seasons due to ambiguity, had a better GF:GA value 68.4% of the time. None of the 136 first round series had two teams with identical goals for and goals against, which means the GF:GA variable could be applied to every series. On the other hand, in these same seasons, teams in the first round with the higher goal differential won 68.1% of the time, which is slightly inferior to GF:GA, while simultaneously there was one series, the Islanders vs Penguins in 2019, where the two opponents had identical goal differential. As a result of having a better win rate and being applicable to more series, GF:GA makes a case as a superior variable if one was to use a goal differential variable in a statistical model.
Conclusion
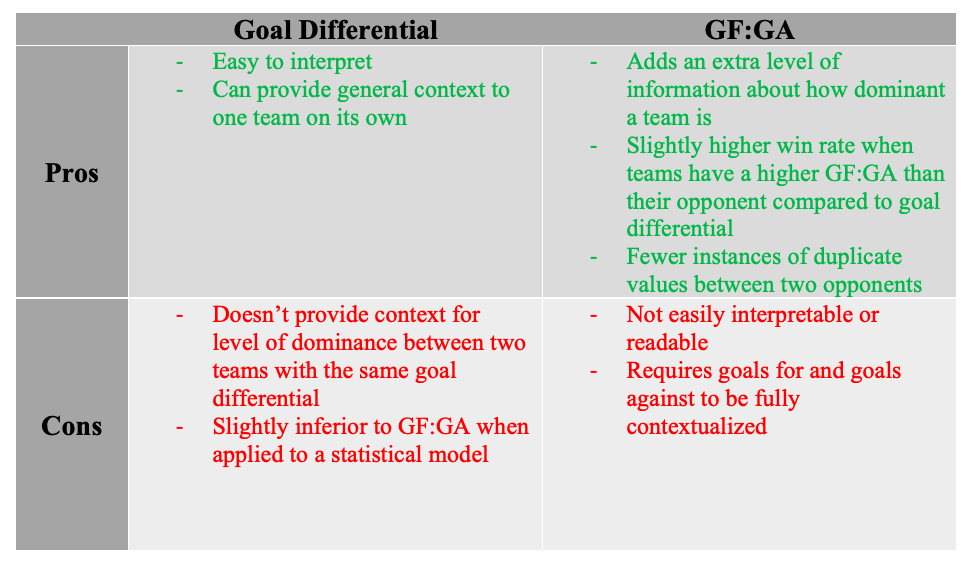
The ratio of goals for to goals against is a superior variable to goal differential from a statistical standpoint, as it provides all information that goal differential provides, while also providing additional information. The additional benefits from GF:GA is that it reveals the net result of a team on a game-by-game basis, and that it has had a slightly better win rate than goal differential when analyzing regular season game winners and first round playoff series winners. Not only this, but GF:GA can also be applied to more games and more playoff series due to having fewer duplicate values between opponents compared to goal differential.
So why isn’t this variable more common and “mainstream”? The primary issue with this variable is it is not easily interpretable, and on its own it doesn’t provide meaningful context. Anyone can get an idea for how dominant a team with a +50 goal differential is regardless of how many goals were scored or allowed, but it’s difficult to interpret the dominance of a team with a GF:GA of 1.25 without the context of how many goals were scored and allowed. For example, a team that scores 5 goals and allows 4 has the same GF:GA as a team that scores 250 and allows 200. As a result, both GF:GA and goal differential have their place, where goal differential is still a good variable and is easier to interpret, while GF:GA is ultimately a more superior variable from a purely statistical perspective, but isn’t as meaningful to use in general hockey discussions.