
Are Extra Attacker Goals Becoming More Prominent in the NHL?
Pulling the goaltender to play 6-on-5 has been a rule in the NHL since March of 1931, with the primary usage being to increase the chances of scoring a goal late in a close game in an attempt to tie it. While there hasn’t been much of any change to the rule itself, the dynamics and strategies around pulling the goaltender has evolved drastically over time. Some of the goalie-pulling strategy changes were covered in a previous article about the rise in empty-net goals, where empty-net goals have increased drastically due to more frequent goalie pulling. Will this also be true for extra attacker goals? This article will answer this question, and also determine if extra attacker strategies are improving and becoming more efficient, analyzing scoring rates when playing with the extra attacker over time.
The Numbers
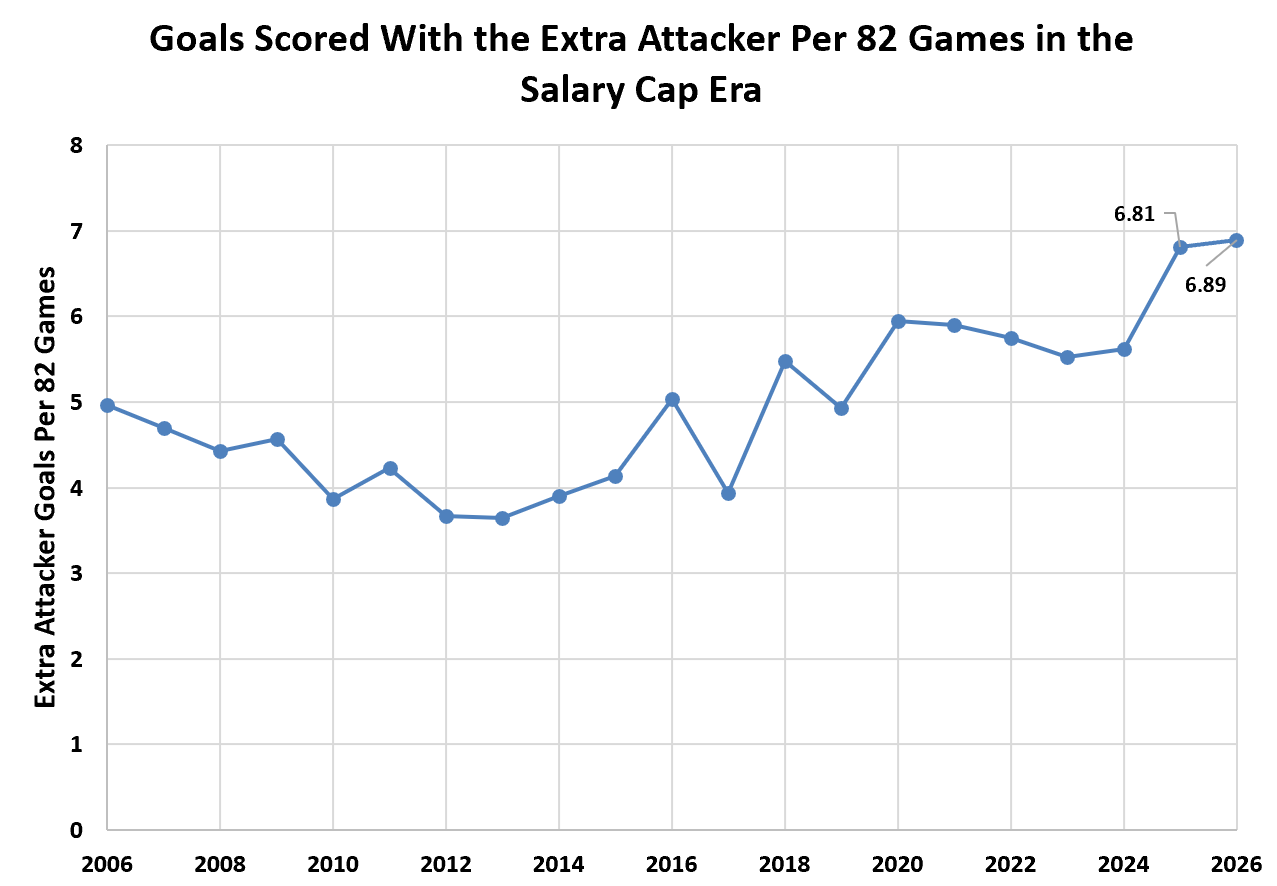
Using More Hockey Stats to analyze goalie pulling in the salary cap era, with all data below being as of February 1, 2026, the rate that extra attacker goals were scored per 82 games of an individual team remained steady from 2005-2006 until 2018-2019, with a lower rate in the mid-2010s. However, beginning in the 2019-2020 season, the league saw a jump in extra attacker goals that has never come down since. Interestingly, from 2019-2024, extra attacker goals remained consistent at a pace between 5.5 and 6 extra attacker goals per team per 82 games. However, this rate jumped once again in the 2024-2025 season, with a rate of close to 7 extra attacker goals being scored per 82 games.
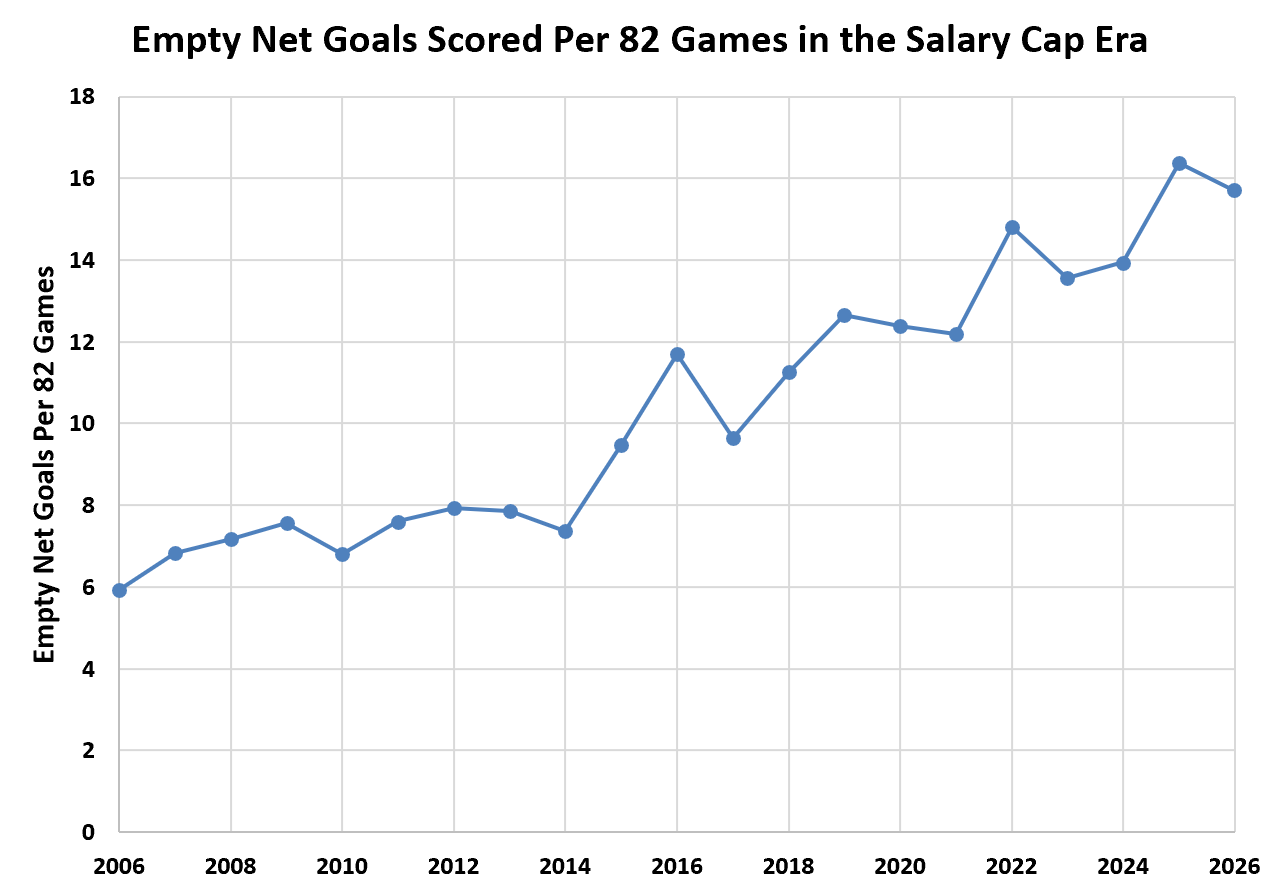
However, it is also important to note that over time, it has become much more common for coaches to pull the goalie earlier. As a result, there has also been a significant rise in empty-net goals allowed.
This can also be seen by the significant rise in time on ice with the extra attacker, as seen by the graph below outlining extra attacker time on ice per game.
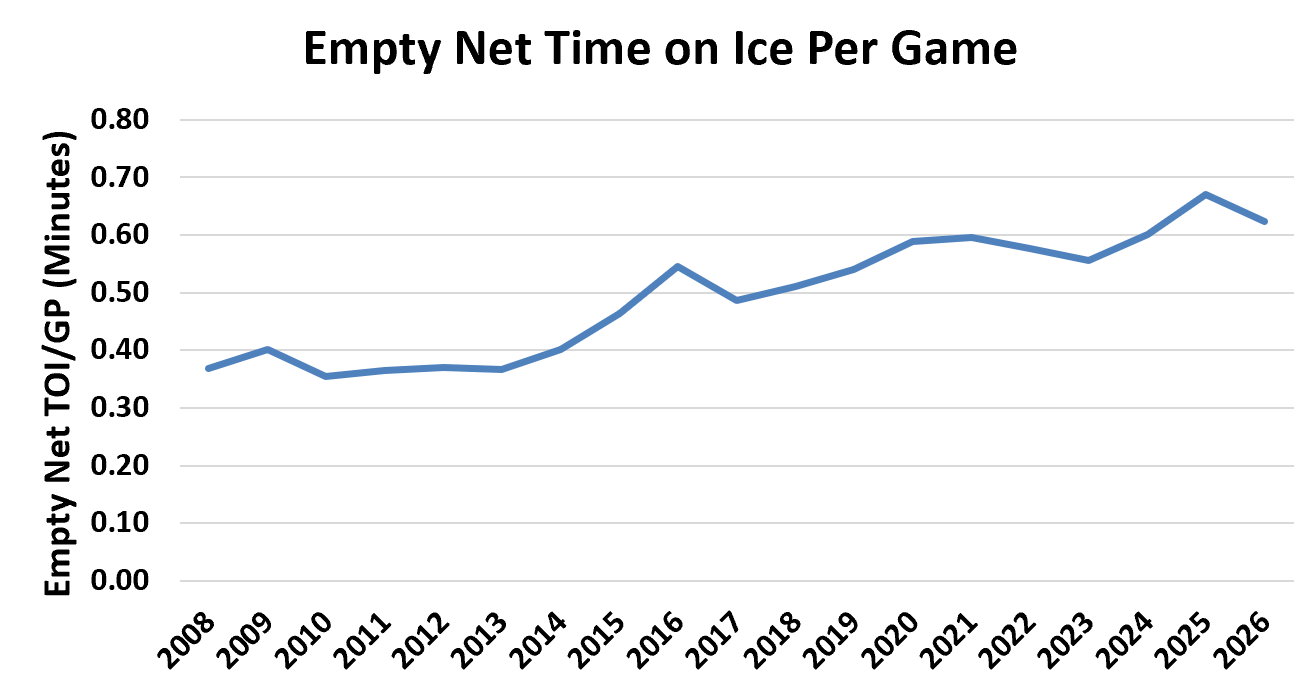
Data only available since 2007-2008; extrapolated from Natural Stat Trick
When looking at the ratio of extra attacker goals to empty-net goals (extra attacker goals/empty-net goals), it appears that despite a rise in extra attacker goals, teams have actually gotten worse playing 6-on-5 hockey, with a ratio of 0.84 in 2005-2006 dropping drastically to a rate between 0.40 and 0.50 starting in 2014-2015.
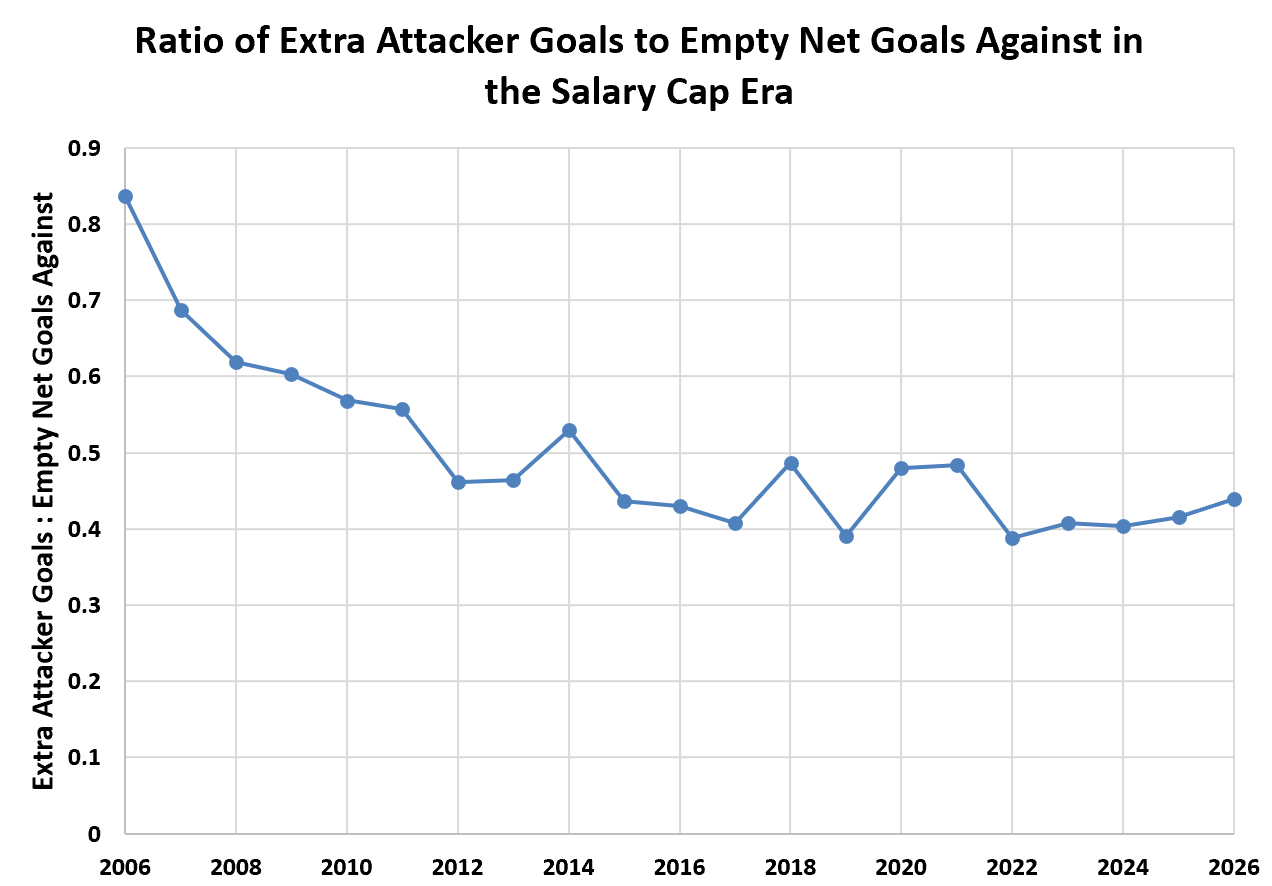
If a team fails to score but simultaneously doesn’t allow an empty net goal, it is not considered in this graph
Without any further context, the collection of these graphs tells us two things; goalie pulling has become more frequent over time, and teams have become less efficient playing 6-on-5 over time. While the first conclusion is undeniably true, the second conclusion needs further analysis. While the ratio of extra attacker goals to empty-net goals is at its highest in 2005-2006, intuitively, pulling the goaltender less often and closer to the end of the game will naturally improve this ratio. This is because when teams score using an extra attacker, they typically do so off of an offensive zone faceoff, and it often takes some time for the defending team to break out of the defensive zone 5-on-6 and score on the empty-net, that is if they do end up scoring at all. Back in 2005-2006 when goalies were typically pulled with closer to one minute left, contrarily to today when 2:30 left on the clock is a common time to pull the goaltender, the ratio of scoring with the extra attacker will be at a disproportional advantage compared to when the defending team has more time to score. Another advantage is that if a team fails to score with the extra attacker but they also don’t allow an empty-net goal, it is not considered in the ratio above. However, if we do account for all instances where a team didn’t score as a failed attempt, it creates a gray area, where teams have seemingly become more efficient today than in 2005-2006.
This conflicting data is why it’s important to look into the advanced stats to dig deeper to determine if extra attacker play has improved over time.
Is Extra Attacker Play is Becoming More Efficient?
Data from Natural Stat Trick will be used to analyze advanced stats when one team is playing with the extra attacker. This data includes all situations, such as the 6-on-5, 6-on-4, etc, as long as a team pulled their goalie for an extra attacker. Some of the key variables that can be used to evaluate extra attacker efficiency are expected goals for per minute, and high danger shots for per minute. These stats were adjusted to a per minute basis due to the gradual increase in time playing with the extra attacker.
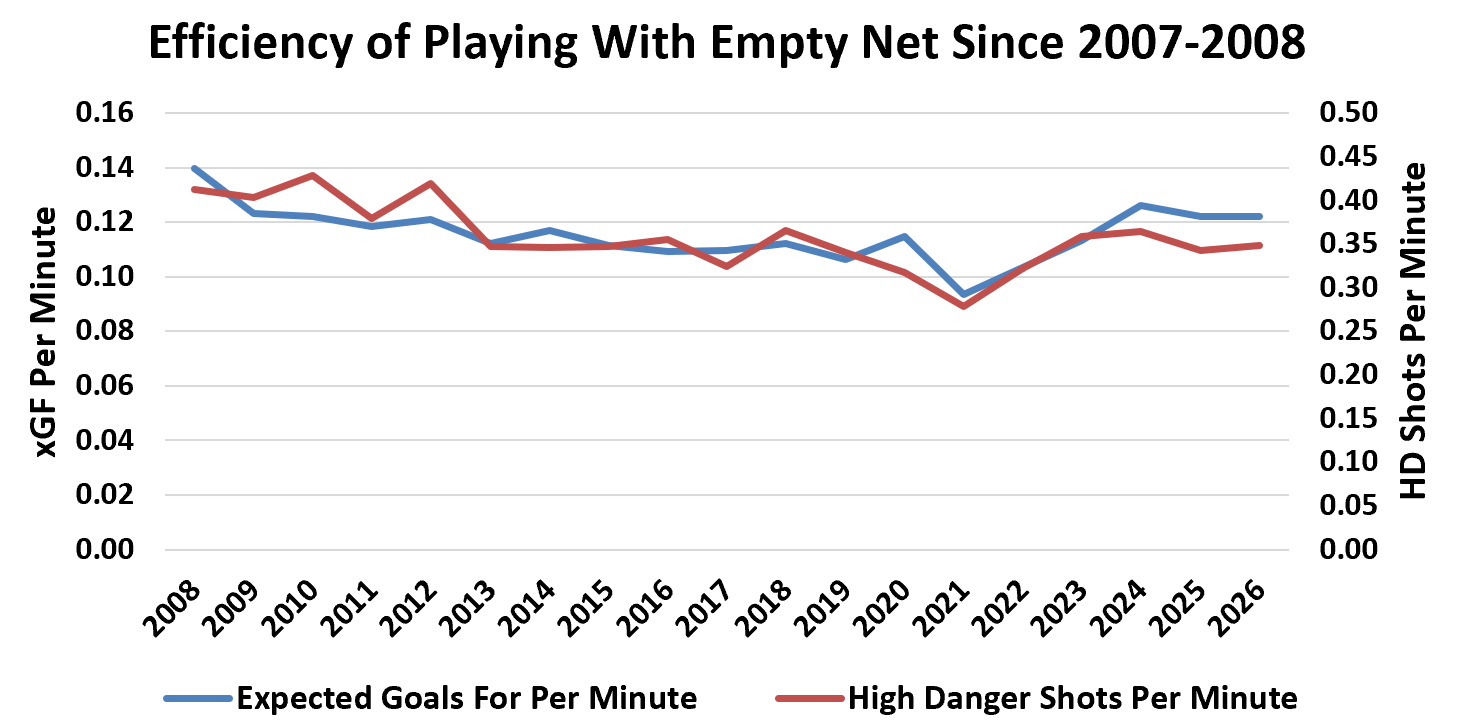
As seen, extra attacker efficiency has actually dropped today compared to 2007-2008. Although expected goals for has increased significantly in recent seasons, it still remains at a lower rate than in 2007-2008. High danger shots per minute is also lower now compared to the late 2000s, but has only increased gradually in recent seasons.
However, even utilizing these advanced stats does not provide a perfect answer. One limitation with this measure is that when teams pull their goaltenders earlier, there is an increased opportunity for the defending team to clear the puck, in turn wasting more game time where the attacking team will not be generating any high danger chances. After all, the difference in expected goals for per minute in 2007-2008 compared to 2025-2026 is not large. The opposite could also be true, where modern teams have a higher chance of pressuring in the offensive zone for longer, but if that is the case, the puck is usually in the back of the net before a significant amount of time is drained off of the clock. As a result, there is insufficient evidence from these advanced stats to conclude an efficiency change in extra attacker goals since 2007-2008, but there does appear to be sufficient evidence to conclude an efficiency increase since the mid to late 2010s.
Conclusion
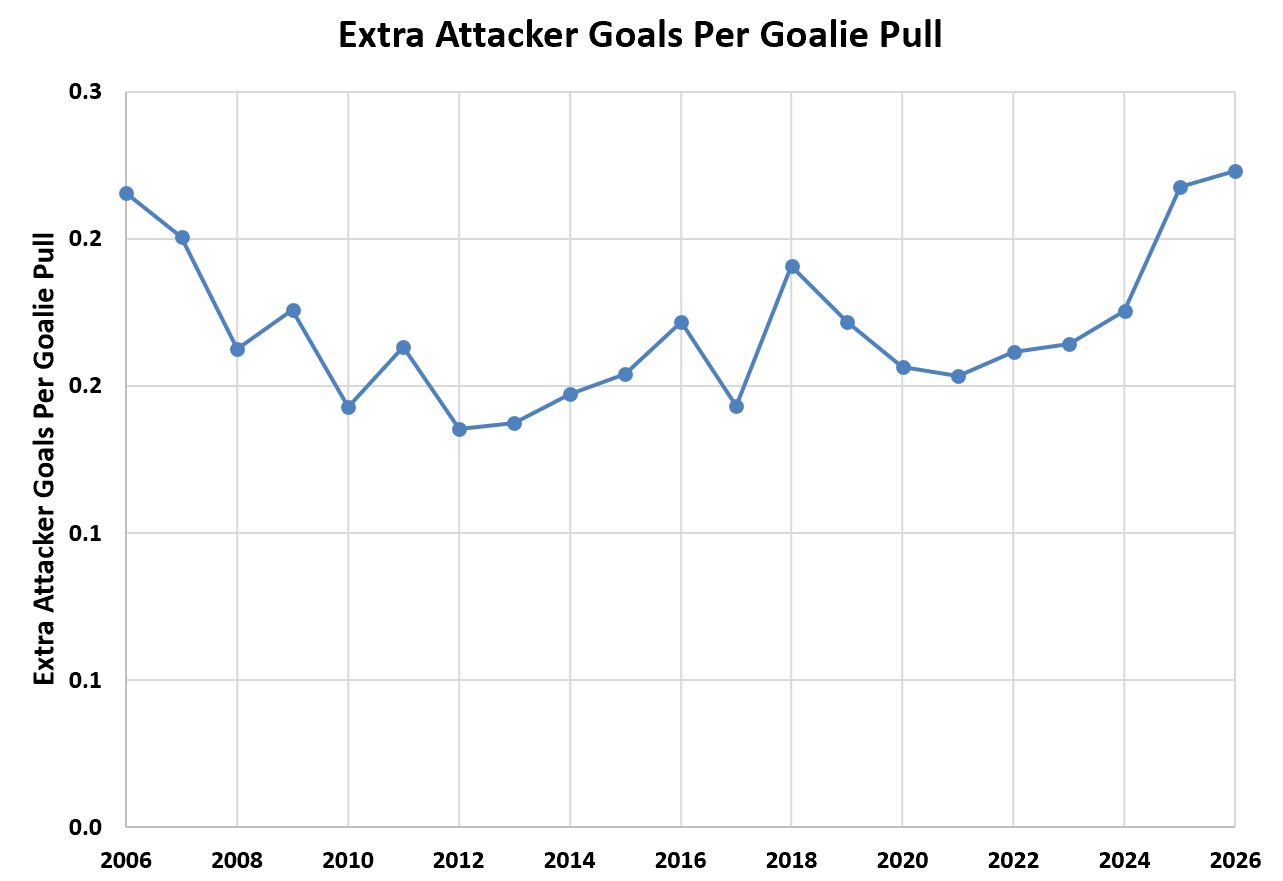
Extra attacker goals have increased significantly since the beginning of the salary cap era, and has seen especially large growth in recent seasons due to more frequent and earlier goalie pulling. However, the question of if 6-on-5 play has actually become better and more efficient is inconclusive. The advanced stats show that expected goals for and high danger shots have decreased since 2007-2008 and have increased compared to more recent seasons, but there are confounding variables that make these findings weak. Contrarily, there has been a significant rise in extra attacker goals per goalie pull, which points towards extra attacker play becoming more efficient.
While there appears to be conflicting data to answer if 6-on-5 play has become more efficient since the beginning of the salary cap era, 6-on-5 play has certainly become more efficient since the mid to late 2010s. All measures of extra attackers per goalie pull, 6-on-5 expected goals per minute, and 6-on-5 high danger shots per minute have increased today compared to the mid to late 2010s.
Implications for Betting
The empty-net rule in hockey creates a unique betting dynamic not seen in other sports’ markets, as it has a significant impact on the spread and over/under. The rise in both extra attacker goals and empty-net goals positively impacts late-game betting. For example, betting on a team down by one goal with five minutes left in the game is more favorable today than in 2005-2006, despite the ratio of goals scored with the extra attacker to empty-net goals allowed being much lower today. The reverse is also true, where betting on a late game spread when a team is up by just one goal has become more favorable in line with the rise in empty-net goals. Betting on the over by one more goal has similarly become more favorable, because whether the team playing 6-on-5 scores or the defending team scores on the empty-net, an extra goal has been scored, positively impacting the over.
To completely understand the dynamics of the empty-net, be sure to check out this similar article The Rise in Empty-Net Goals.