
Why the Final NHL Standings Are Mostly Determined by American Thanksgiving
American Thanksgiving has become a popular checkpoint in NHL seasons, as it is typically around the seven week mark of the season where the “early season craziness” has settled down and teams are typically in their realistic positions where they will end up by the end of the season. This isn’t true in all cases, but is generally true for most teams in a given season. This article will look back at the numbers and determine why this is the case.
As seen by the graph below, in the salary cap era, over 70% of teams in a playoff position at American Thanksgiving, ordered by points percentage, maintain their playoff position by the end of the season.
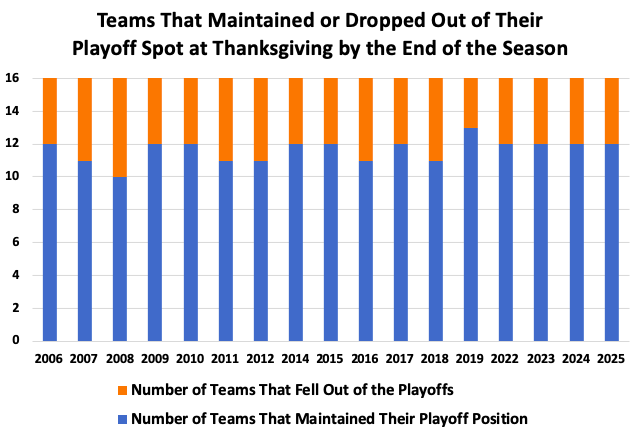
The numbers are very similar when looking at pure points, but points percentage is a more honest assessment and will be used throughout this analysis, as not all teams have played the same amount of games at this point of any season. Excluding the three shortened seasons of 2013, 2019-2020, and 2021, 198 out of the 272 playoff teams since 2005-2006 were in a playoff spot at American Thanksgiving; a rate of 72.8%. Because the league expanded over the past decade, this rate increases when looking at the number of teams that maintained their status as either a playoff team or a non-playoff team, where 76.2% of all teams at American Thanksgiving did not cross the playoff line up or down at the end of the season. The 2007-2008 season was the most volatile, with six non-playoff teams at Thanksgiving sneaking in and making it into the playoffs by the end of the season, while 2018-2019 had only three teams do this. However, one of these teams also happened to be one of the most successful “comeback” teams of all time, the St. Louis Blues.
Shown in the below graph are the teams that had the largest conference ranking changes from Thanksgiving to the end of the season, where the 2018-2019 Blues are tied for third, moving up nine spots from 14th to fifth in the Western Conference.
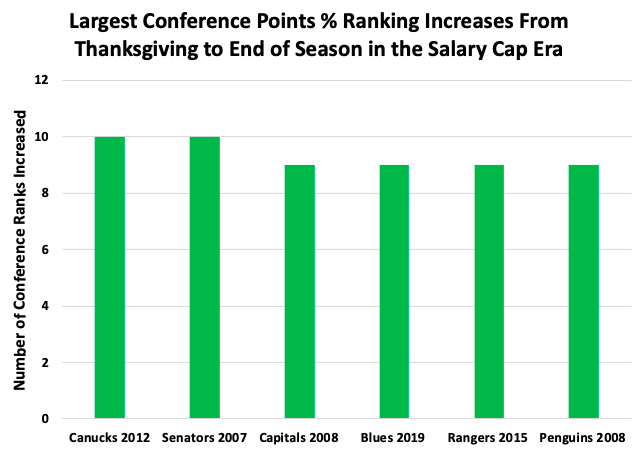
The other teams shown were also successful, with the 2011-2012 Vancouver Canucks and 2014-2015 New York Rangers winning the Presidents’ Trophy, and the 2006-2007 Ottawa Senators and 2007-2008 Pittsburgh Penguins both making it to the Stanley Cup Finals.
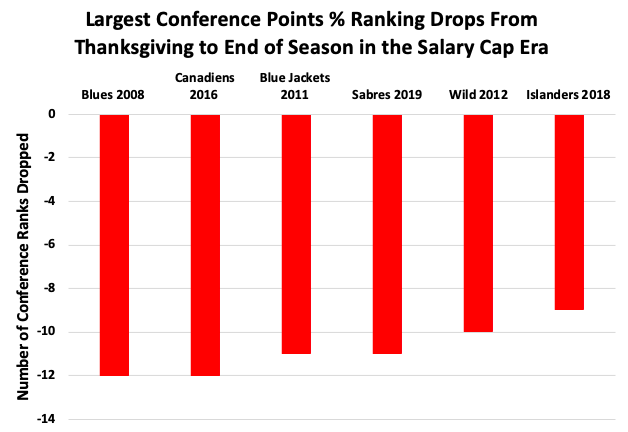
On the opposite side of the spectrum are the teams that fell the hardest in terms of their points percentage ranking in the conference. The 2007-2008 St. Louis Blues and 2015-2016 Montreal Canadiens both fell 12 spots, obviously missing the Stanley Cup Playoffs. The 2018-2019 Buffalo Sabres gave their fans hope of finally returning to the Stanley Cup Playoffs with an early season 10-game winning streak, only to join the 2016-2017 Philadelphia Flyers as the only other team in NHL history to miss the playoffs despite achieving a double digit winning streak at some point in a season.
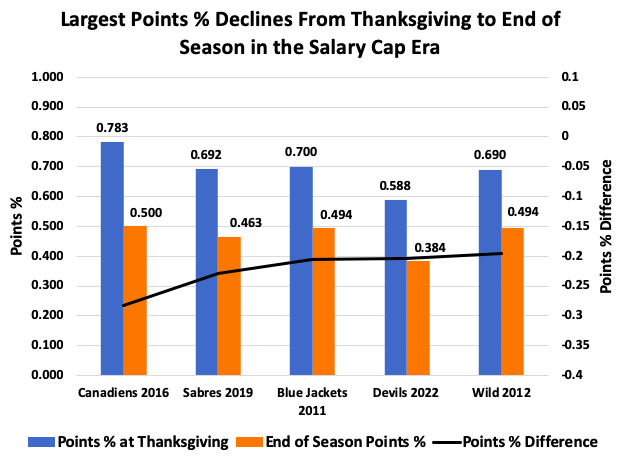
In terms of points percentage decline regardless of standings ranking, there is a lot of overlap, but the 2015-2016 Canadiens are firmly in first place with a points percentage drop of .283, going from .783 at Thanksgiving to .500 by the end of the season. The aforementioned 2018-2019 Sabres are the runner ups for this category, falling by .229.
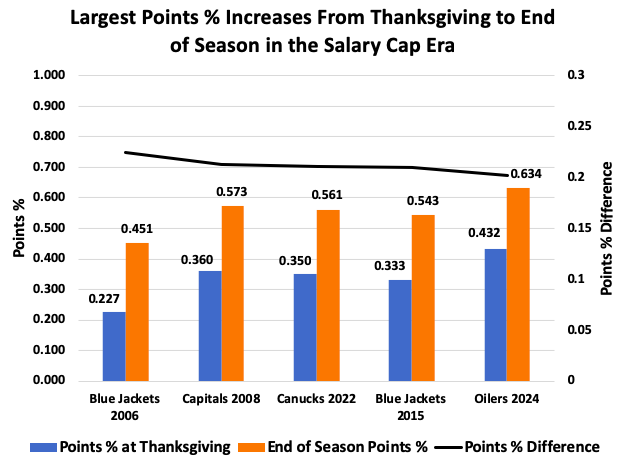
In terms of the largest risers in the salary cap era, the 2005-2006 Columbus Blue jackets went from .227 to .451; a .224 points percentage increase. However, this is more so because of their poor start, rather than a miracle comeback story that ended in playoff hockey. The same scenario happened with the 2021-2022 Canucks, where they had a feel good story of improving by a points percentage of .213 in part because of Bruce Boudreau taking over as head coach, however, they still missed the playoffs.
Accounting for the most miraculous comebacks of slow starts that resulted in a team making it to the playoffs, below is a graph that shows the largest points percentage increases from Thanksgiving to the end of the season among playoff teams.
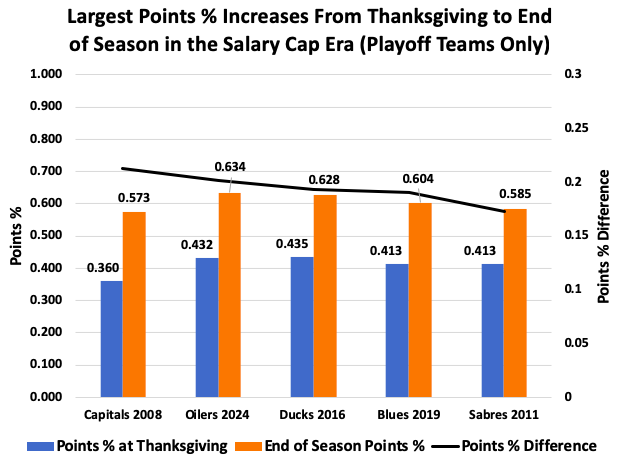
The 2007-2008 Washington Capitals lead, where they went from a points percentage of .360 to .573, winning 11 of their last 12 games to sneak into the playoffs by two points. While the Capitals lost in the first round, the second most miraculous comeback, the 2023-2024 Edmonton Oilers going from a points percentage of .432 to .634, were only one win away from winning the Stanley Cup. Part of their comeback included a 16-game winning streak, tied for the second longest in NHL history. It’s also not surprising to see the 2018-2019 Blues make a return, as their .191 points percentage improvement is the fourth most among playoff teams, and the most successful of all teams that required a comeback of extreme measures.
To circle back to the general trend and ease away from the extremes, the majority of teams finish within two ranks of their Thanksgiving conference rank, up or down, by the end of the season.

Number of risers and fallers are not perfectly equal since a team moving up multiple ranks may cause multiple teams to drop, and vice versa
However, there has been a common argument that this year may be different than the usual approximately 70-75% of playoff teams maintaining their playoff spot. This idea is circulating because of the competitiveness in the standings, where only four points separates the top team in the Eastern Conference and the second wild card team, and excluding the outlier Colorado Avalanche, only five points separates the second wild card team and the second best team in the Western Conference. This is in large part due to the noticeable rise in overtime games, as discussed in this article, and there is a lot of validity to this point. The below graph shows the league average points percentage and standard deviation at every Thanksgiving in the cap era.

2025-2026 league average points % and standard deviation are based on stats after all games finished on Nov. 25, 2025
The minimum a league average points percentage can be is .500, and that is only possible if there is not a single overtime game played. In 2025-2026 the day before Thanksgiving, the league average points percentage is at a salary cap era high of .571, once again in part due to the significant rise in overtime games. While this does simultaneously make the standings tighter, with teams losing in overtime receiving an extra point to keep up with the winners, the standard deviation of .094 is actually the fourth lowest in the salary cap era; not as extraordinarily low as one might expect. Without getting too technical, in this context a lower standard deviation would indicate that teams in the standings are closer together. So far in the 2025-2026 season, a team would only have to be .094 points percentage above average to typically achieve a Z-score of one, which in a normal distribution is approximately the 84th percentile, while the exact average is the 50th percentile. Based on this data, it does not appear that this season will be any different than the historical trend, and that we should expect around three quarters (75%) of all teams maintaining their position as either a playoff team or non-playoff team when ordered by points percentage by the end of the season.
Now as the overarching question, why is this the case? Why is there typically little movement in the standings when the NHL season is still technically quite young being only a little over one-quarter of the way through? The most likely explanation is just based on the law of averages and basic mathematics. By Thanksgiving in most seasons, teams have played approximately 25-30 games. This is a large enough sample size to detect which teams are truly superior compared to others, something that is much more difficult to gauge in October or early November when teams get off to unsustainably hot starts, or they have a specific player or goaltender playing at a pace that is unlikely to continue. In other words, teams still struggling to this point are unlikely to turn it around, and teams doing well will most likely continue to play well and make it to the Stanley Cup Playoffs. Additionally, a team being only a few points back of the playoff line means this team not only needs to play better than their current pace, which as mentioned is unlikely for most teams to pull off because the law of averages usually reveals their true capabilities, but also because it requires other teams currently higher in the standings to play worse. When these two factors are combined, it is very unlikely to see significant change for most teams, which is why the majority of teams that do drop out of the playoffs were close to the playoff line, as shown in the ranking change frequency distribution graph earlier. This is also why we very consistently see only four playoff teams drop out, such as two in each conference. It would be extremely unrealistic to expect close to half of the playoff teams over a quarter of the way through the season to all drop out for other teams who are likely not playing as well. When broken down, it’s actually pretty sensical as to why there is little change despite it being “early” in the season. However, what makes it seem more improbable than it is is the fact that there are still so many games remaining, which creates the illusion that there is more time for teams to catch up than there really is.