
Goal Scoring and Over/Under Trends Throughout the NHL Season
As the 2025-2026 NHL regular season is near, so too are all of the sports betting advertisements, and with that comes traffic to NHL game odds and one of the most popular betting categories, the over/under. The over/under is simple; a “total” is set at a certain amount of goals, where bettors bet on if there will be more (over) or less (under) goals scored in the game compared to the total. Before the game starts, the total is usually set between 5.5 and 6.5 depending on which two teams are playing, with the total changing throughout the game depending on the score and time of the game as it is played. Whether or not the over/under is as effective as other betting categories like the spread or money line is a topic for another day, but this article will aim to help fans and bettors alike by revealing total per game goal trends at the beginning of the season versus later in the season, and look at average month-by-month and day-by-day scoring trends. For this analysis, every game in the salary cap era from 2005-2025 was analyzed, with the exception of the shortened 2013 and 2021 seasons due to their smaller size and lack of inter conference play.
Scoring in the First 200 Games
For the first experiment, scoring in the first 200 games is compared to scoring after the first 200 games. Using a calendar date as the cutoff is not consistent since regular seasons start on different dates, although the 200 game mark is typically around early to mid November. Below is a graph that showcases total goals per game in the first 200 games of the season, versus total goals per game in games 201 and beyond.

As seen, in 14 out of 18 seasons, the average number of goals scored per game was higher in the first 200 games than after. Not only this, but scoring is often noticeably higher in the first 200 games. This is most likely due to the “rustiness” of players after returning to hockey after being off for multiple months, which would most likely have a greater impact on the defensive aspect of the game. Although three out of four times scoring was lower in the first 200 games, it was not a large difference compared to scoring later in the season, especially in 2010-2011 where the two were almost equal. The 2021-2022 season is the only outlier, where scoring was significantly lower to begin the season. While this could be a coincidence, it could also be an effect of being the first season after a year and a half of Covid-impacted hockey, whether that has an implication on goal scoring or not due to factors such as stricter traveling rules and players in and out of the lineup due to Covid-19 symptoms that were more prominent in October of 2021 than the spring of 2022. While 200 games is a good benchmark to define the early portion of a season, it is important that this is an arbitrary cutoff on its own. To view this topic from another angle, we can also look at scoring based on what percentage of the season has been played.
Scoring Based on Season Progress as a Percentage
Season progress as a percentage allows for a slight adjustment in that not all seasons play the same number of games. From 2005-2017, there were 1,230 games played each season. However, with the league expanding in 2017 and then again in 2021, the NHL had 1,271 and 1,312 games respectively in more recent seasons, not to mention the slightly shortened 2019-2020 season due to Covid-19. Below is a chart where the first 10.0% of the season will be considered the early season.

The number of seasons where scoring was higher in the first 10% of games was 12 out of 18, whereas the latter 90% of games had more scoring in 6 out of 18 seasons, a slight increase from the 4 out of 18 in the 200 versus after 200 game experiment. However, similar to the previous experiment, aside from 2021-2022, in seasons where later games were higher scoring on average, the difference was usually smaller compared to seasons where early games were higher scoring; although unlike the previous experiment, the 2011-2012 season has a much larger difference in scoring under the 10% versus 90% model. While in three of the last four seasons early season scoring was actually lower, the difference in both the 2022-2023 and 2023-2024 seasons was small, and prior to 2021-2022, there were four consecutive seasons of significantly higher scoring in the early season. However, as a third perspective, the early and non-early seasons can be adjusted to a more conservative boundary to extend the definition of the “early season”.
Below is a chart where the “early season” is expanded to the first 25.0% of games.

The most noticeable change when expanding the “early season” to a larger percentage of games is that the difference generally shrinks, as was expected. This time, 13 out of 18 seasons saw higher scoring earlier in the season, and 5 out of 18 seasons saw higher scoring in the latter 75% of games. Once again, the 2021-2022 season stands out as having significantly more goals in the later season than early season, and it actually turns out that scoring gradually increased after each month of the 2021-2022 season; not once was there a decline. As we will find out shortly, this is an unusual monthly trend, and gives reason to believe that the characteristics of the 2021-2022 season are unlikely to be replicated in the future.
From the first three experiments, there is confidence in the fact that early season scoring is generally higher. However, so far the early season has only been compared to the non-early season as a binary comparison. Examining the month-by-month breakdown provides more comparisons and may reveal a more insightful trend.
Scoring Based on the Month
In general, NHL regular seasons start in early October and end in mid-April. While there are exceptions, such as the shortened 2013 and 2021 seasons, since these two seasons are already excluded from this analysis, each month is well represented by each season. While some months within seasons were not balanced, such as the 2006, 2010, and 2014 Olympics causing fewer February games or schedules having fewer April games every season than other months, because the sample includes 18 seasons within the salary cap era, and because this analysis looks at average goals scored and not total goals, this is not an issue. The graph below shows the month-by-month scoring trends.

Two September games in 07-08 and one May game in 21-22 ignored due to small sample size
As expected, October is amongst the highest scoring months due to the assumed effect of players being rusty; but what was surprising is the fact that November saw a significant drop in scoring, despite the fact that in some earlier models it would have been considered the “early season”. The most likely explanation for this is that after the high-scoring October, coaches and teams “over correct” and tighten up defensive errors and play more conservatively, until scoring finds its natural equilibrium in the mid-season. While April is literally the latest month in the regular season, it is not exactly surprising that it is the highest scoring. With many teams aware of their position in the standings, hockey in April is usually more loose and less strict, with some teams resting players in preparation for the post-season. Another explanation could be that in April, intra divisional games become common, and these games are usually more intense than non-divisional games, which could lead to more power plays and more goals. A final explanation for April being the highest scoring month could be the fact that there are approximately half to two-thirds fewer games played in April than most other months, which means there may be a larger margin of error. However, this is highly unlikely since the total number of April games in the sample (1,565) is still very large. In fact, if anything, April should theoretically be even higher scoring than it already is since there were no games played in April of 2020, and the 2019-2020 season was one of the higher scoring seasons in the salary cap era.
Scoring Based on the Day
Scoring based on the month provided interesting insight into how scoring may change based on how these months are ordered in the season. However, as a final experiment, the most specific test can be taken, which is scoring based on each day of the season, where day one is the first day regular season games are played, and the final day is when the final regular season game has been played. Days without any NHL games are not counted as days in the season.

The above graph shows the average scoring at each day of the season. The most days a season ever had was 189 in the 2021-2022 season, but day 178 will be the final day considered, as all days afterwards have much smaller sample sizes in games played due to the fluctuating season lengths from year to year. However, as seen by the above graph, this information becomes far too specific and does not reveal anything meaningful that can be reliably interpreted for future outcomes. Instead, each day can be categorized into “buckets” of 20 days, where the first bucket is season days 1-20, and the final bucket is season days 161-180. This will lead to a result similar to the monthly analysis, while also becoming slightly more specific without becoming uninterpretable.
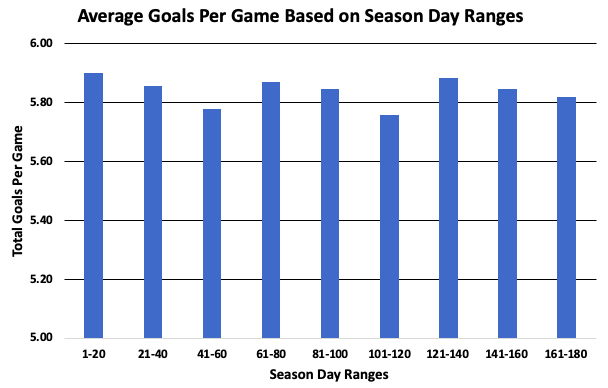
Funnily enough, each sequence of three buckets within the nine follow a similar pattern, where the first bucket has the highest average goals, the second bucket has fewer goals, and the third bucket has the fewest average goals, before jumping up and repeating the pattern. The first 20 days had the highest average goals per game, whereas days 101-120 had the fewest average goals per game. While these results are technically the most accurate when comparing how scoring differs depending on different points of the season, it is not the most practical, and is similar enough to the monthly analysis, where bettors would be better off making decisions on this topic based on the more straightforward monthly analysis than the day-by-day analysis.
Conclusion
After analyzing average scoring per game at different points in the season, that being the first 200 games versus games after the first 200, the first 10% of games and the latter 90% of games, the first 25% of games and the latter 75% of games, month-by-month scoring trends, and day-by-day scoring trends, it was found that in the salary cap era, and removing ambiguous seasons, scoring is typically higher earlier in the season. The monthly analysis helped uncover the fact that November, while often still considered the early season, is actually the lowest scoring month, and that betting on the over would be more optimal in October, and again in April. All months in between October and April had noticeably lower scoring, with December seeing a slight boost in comparison to November, January, February, and March. While it’s not entirely conclusive, the most likely explanations for these trends are that players are much rustier in the beginning of the season when returning to hockey in October after their summer break, teams “over correct” in November with tighter defensive strategies, and games in April are typically more loose due to teams securing their final positions in the standings, as well as a larger proportion of games against divisional rivals, which are often more intense and result in more power plays.
For additional support on over/under betting, as well as numerous other betting categories, check out the Slapshot Bet’s head-to-head data product, where you can find goals per game stats of all 496 head-to-head matchups within seconds to see which pairs of teams tend to be involved in high scoring games and low scoring games.