
How End of Season Performance Dictates Next Season Performance in the NHL
As discussed in a previous article, predicting large increases and drops in the standings from one season to the next is extremely difficult to do, if not entirely based on sheer luck and general thought, and not based on any quantitative reasoning. However, this previous article was more focused on some of the qualitative and unpredictable factors, such as injury and team chemistry.
This new article will take a quantitative approach and look at if performance at the end of a regular season impacts a teams’ standing in the following season, with the hypothesis that a strong second half or fourth quarter of the season could imply upward momentum into the next season. However, because playoff teams continue to play hockey after the regular season finishes, analyzing how playoff teams finished the regular season is likely ineffective. Instead, this analysis will focus on non-playoff teams to see if there are any relationships with finishing a season strong and jumping into the playoffs next season. All numbers will be taken in the salary cap era with the removal of analyzing years previous to the 2005-2006, 2013, 2021, and 2021-2022 seasons, as each of these seasons listed had unusual circumstances prior to the season starting, which would interfere with the consistency of this hypothesis. The fourth quarter is defined by Q4, which will be considered as the final 20 games of a full 82 game season.
The Importance of This Topic
To start, let’s first look at the value that comes from predicting changes in playoff teams. In the salary cap era beginning in 2005-2006, there have been 196 teams to “change their status” as a playoff team and non-playoff team the following season, with the 2017-2018 Vegas Golden Knights treated as a team that was previously a non-playoff team for simplicity. In other words, in the salary cap era, there have been 98 teams to qualify for the playoffs that weren’t in the playoffs in the previous season, and 98 teams that missed the playoffs after qualifying for the previous post-season. This results in an average of slightly more than five new playoff teams per season (5.16), and simultaneously, more than five previous playoff teams dropping per season. In other words, we can typically expect 11 of the previous 16 playoff teams to return to the playoffs the following season. The highest number of changes is a four-way tie with 14 changes (seven new playoff teams, seven dropping out from previous year), whereas 2010-2011 and 2023-2024 had the fewest changes compared to their previous seasons, with only six (three new playoff teams, three dropping out from previous year).

This is important because it tells us with near certainty that there will be new playoff teams every year. With an average of 10.32 changes per season and a standard deviation of 2.43, the probability of having only two changes (one new playoff team, one dropper) is a 0.01% chance, making the probability of zero changes an incomprehensibly low chance. Because of this, predicting risers and fallers ahead of the season can be a great way to capitalize on favourable odds, given that there will always be a recency bias towards previous playoff teams.
Analysis
Beginning by comparing Q4 points percentage with total points percentage the following season, a perfect relationship would be if all data formed a diagonal line on the graph below, going from bottom left to top right. However, as seen by the below graphs, there is a very weak, positive correlation between these two variables. Second half points percentage follows a similar pattern.
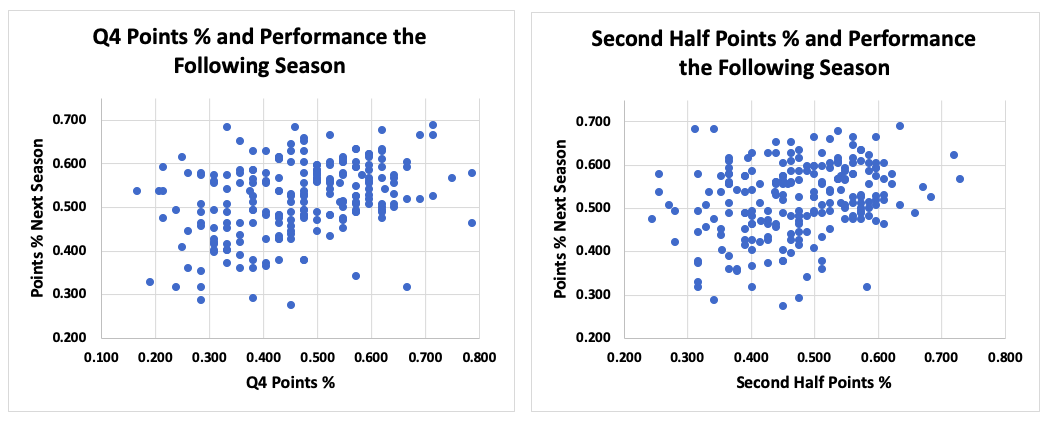
Weak, positive correlation between Q4 Points % and Points % Next Season
The correlation between Q4 points % and points % next season has an R value of 0.350, a weak to moderate correlation, whereas second half points % has a slightly weaker correlation of 0.284. For context, an R value of -1 would imply a perfect negative correlation, an R value of 1 would imply a perfect positive correlation, and an R value of 0 implies there is no correlation at all, with all values in between being up for interpretation. Typically in statistics, R values can only measure relationships between continuous variables; for example, height and its relationship with weight. Although points percentage is not a continuous variable, it can be used in this context since points percentage values take on a wide range, and the sample size is large.
The above graphs give us the most clear answer to the hypothesis, that being that there is a small, but weak correlation with end of season performance and points percentage next season. However, ending the analysis there would still leave questions on the table. Another angle is to utilize categorical variables, with one relationship being how a team’s end of season performance impacts their playoff status next season. As seen by the below graphs, although the proportion of teams that qualify for the playoffs next season increases the better they perform towards the end of the season, especially when looking at Q4 performance compared to second half performance, it still reveals itself to be a weak correlation, but visibly represents why Q4 performance had a slightly better correlation than second half performance when looking at next season’s points percentage from earlier.
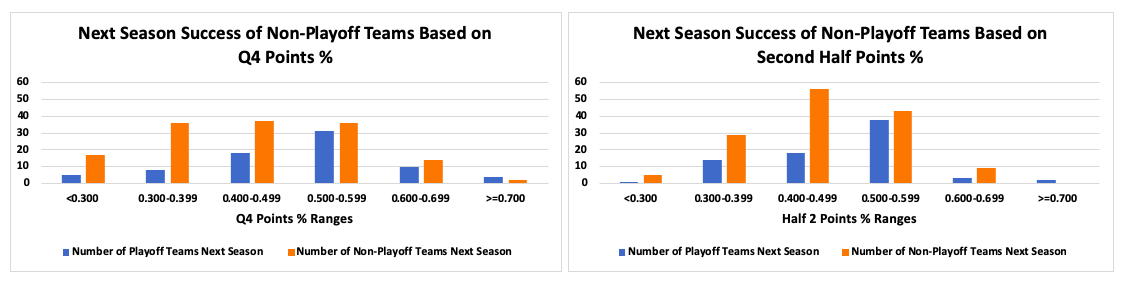
We can similarly see a correlation, but a weak one, when looking at average points percentage next season when categorizing Q4 and second half points percentage into different ranges as done in the above graphs.

When looking closer at teams that had a better Q4 points percentage than their total regular season points percentage, 55.5% of teams improved next season. When teams had better second halves compared to their total points percentage, which in other words looks at teams with better second halves compared to first halves, 58.0% of teams improved next season. These numbers emphasize that, although both metrics are over 50.0% and are in the direction of the original hypothesis, it is nonetheless a weak correlation as concluded by every other section of this topic.
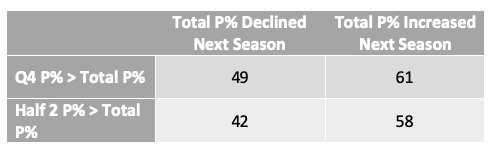
Excludes teams that didn’t have a better Q4 P% or Half 2 P% than Total P%
Finally, we can look at the largest risers from one season to the next and observe their Q4 and second half points percentages. Below is a graph that shows non-playoff teams that had the largest points percentage increase next season, while also displaying their Q4 and second half numbers. Amazingly, not a single one of the top 11 teams had a Q4 points percentage above 0.500, and the 2015-2016 Blue Jackets are the only team with a second half points percentage above 0.500.

Non-playoff teams who had the largest points % increase the following season
Conclusion
After observing the relationship between end of season performance and performance next season by using non-playoff teams in the salary cap era while excluding all seasons that were ambiguous, as well as digging in deeper with specific criteria, it is clear that there is a positive, but weak correlation between end of season performance (both Q4 and second half performance) and regular season performance next season. This reveals that how a team finishes in one season is not a good variable to use to predict performance the next season. It is much more likely that other factors such as player development, roster changes, staff changes, and other factors such as injuries have a much greater impact on year-to-year changes in a team’s performance.