
The Chances of Winning a Series After Winning Each Game
This article breaks down the percentage of series that are won after teams win games one to six in different situations and by round. All 771 best-of-seven series from 1939-2024 are analyzed, with the best-of-seven format being implemented in the 1939 post-season. No data from the 2025 Stanley Cup Playoffs have yet been taken into account in order to keep a consistent ratio when comparing round to round. Round names are defined by the round number and not the formal name of the round. This is because the number of rounds in the Stanley Cup Playoffs have changed over time. For example, the Stanley Cup Finals in 1950 was the second round, whereas the Stanley Cup Finals in the modern NHL is the fourth round. Note that the intention of this article is to analyze the percentage chance teams have of winning a series after winning a specific game in different scenarios. Because of this, scenarios where a team wins a game to then win the series are excluded, as these are an automatic 100% win rate.
Series Win Rates After Winning Game 1
After winning game 1, the total series success rate is 68.0%. Round four has the highest success rate at 71.4%, while round one has the lowest success rate at 66.8%.


Total Results When Winning Game 1
Series Win Rates After Winning Game 2
Game 2 can be split into two scenarios; teams that win game 2 being up 1-0, and teams that win game 2 while being down 1-0. Of teams that are already leading 1-0 and win game 2 to take a 2-0 series lead, the overall win rate is 86.3%, with the later rounds having an even higher win rate. In other words, only 13.7% of teams have come back from a 2-0 deficit. Of teams that win game 2 to tie the series 1-1, the win rate is 52.6%, which is interestingly higher than 50.0%, perhaps due to the momentum it carries into later games. Similarly, teams in the later rounds have a higher winning percentage under this scenario, making game 2 a crucial game to win whether up 1-0 or down 1-0.


Total Results When Winning Game 2
Series Win Rates After Winning Game 3
Game 3 can be split into three scenarios; teams that win game 3 being up 2-0, teams that win game 3 in a 1-1 series tie, and teams that win game 3 after being down 2-0.
When a team wins all of the first three games, they understandably go on to win 98.1% of the time, as there have only been four “reverse sweeps” in NHL history. Of the four reverse sweeps, three occurred in the second round, and none have ever occurred in rounds three or four.
When a series is tied 1-1, game three is a crucial game to win and carry momentum into further games, as these teams go on to win 66.1% of the time.
Finally, teams that win game 3 after being down 2-0 still only win 26.3% of the time. Interestingly, teams that end up down 2-1 after the series was tied 1-1 have a win rate of 33.9%, a noticeably better win rate than teams down 2-1 after first being down 2-0. This may be due to the fact that teams that go down 2-0 are more likely to be outclassed by their opponent, whereas teams involved in a 1-1 series are more evenly matched.


Total Results When Winning Game 3
Series Win Rates After Winning Game 4
Game 4 is the first game where a series elimination is possible. Excluding teams that win game 4 after being up 3-0, as that results in a series win, game 4 can be split up into three scenarios; teams that win game 4 being up 2-1, teams that win game 4 being down 2-1, and teams that win game 4 being down 3-0.
Only 10.5% of teams come back to win after going down 3-1 in the series, which becomes increasingly rare in the latter rounds. In fact, the 2000 New Jersey Devils are the only team in NHL history to overcome a 3-1 series deficit in either rounds three or four.
Perhaps most interesting is the scenario where the team who wins game 4 ties the series 2-2. While one might think winning game 4 will provide momentum into future games, it actually results in a win rate of 49.8%, nearly as close to 50/50 as possible.
Teams who win game 4 after being down 3-0 only win 4.9% of the time, that being the four teams who completed the reverse sweep. Interestingly, teams who end up being down 3-1 after a 2-1 series lead have more than double the win rate of teams who end up down 3-1 after being down 3-0 (10.5% versus 4.9%).


Total Results When Winning Game 4, Not Including When Teams Win Series 4-0
Series Win Rates After Winning Game 5
Since teams that win game 5 after being up 3-1 win the series, this scenario is excluded. Instead, game 5 can be split up into two scenarios; teams who win game 5 with the series tied 2-2, and teams who win game 5 while down 3-1. When a team wins game 5 after the series was tied 2-2, that team goes on to win the series 79.0% of the time. This is understandable, as a team coming back from 3-2 must win both game 6 and game 7. Teams coming back from 3-2 after first being down 3-1 become increasingly less common as the rounds progress.


Total Results When Winning Game 5, Not Including When Teams Win Series 4-1
Series Win Rates After Winning Game 6
Game 6 has just two possible outcomes; either the team up 3-2 wins the series, or the team down 3-2 wins to tie the series and force a game 7. Because the former results in an automatic series win, this analysis will only look at the success rate of teams who win game 6 after being down 3-2. In other words, this scenario answers the question of whether winning game 6 to force a game 7 is more advantageous than being up 3-2 and failing to close out the series in game 6. While the common sense hypothesis may be that teams who win game 6 carry the momentum into game 7, the stats don’t support this, as 47.5% of teams who win game 6 to force game 7 win that game 7.
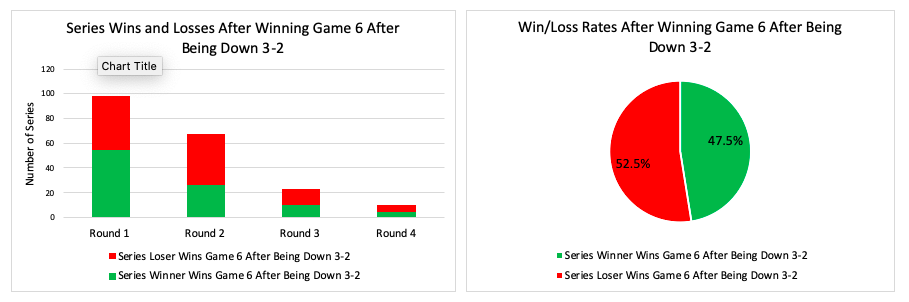

Total Results When Winning Game 6, Not Including When Teams Win Series 4-2