2025 Stanley Cup Playoffs - First Round Prediction Analysis
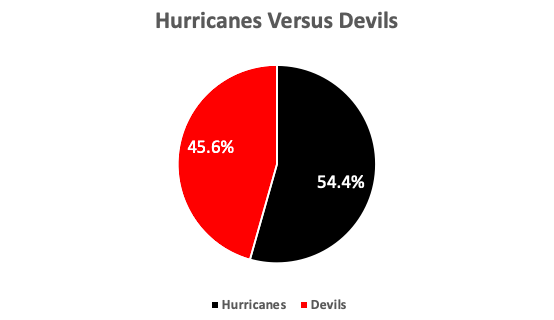
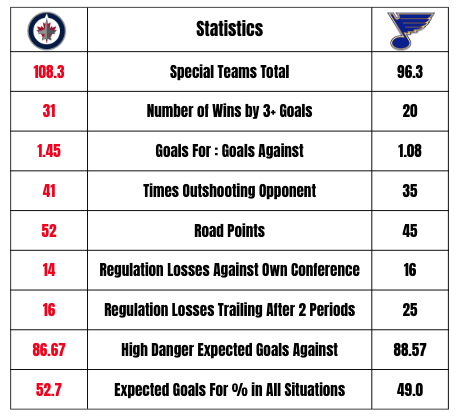
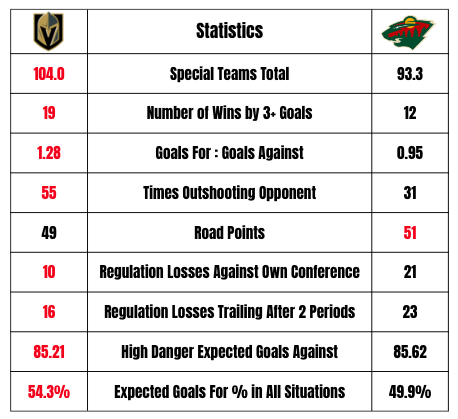
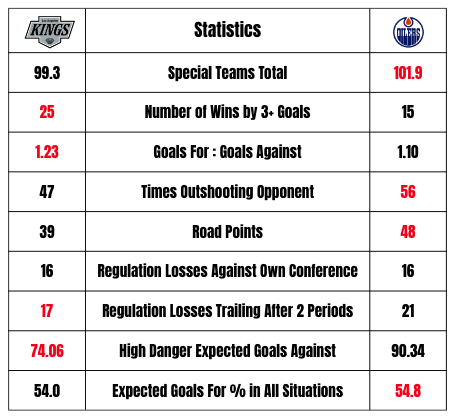
After analyzing hundreds of different variables and statistics, below is a breakdown of the first round series winning probabilities for each team. The results were found using a logistic regression model, narrowing down the most significant predictor variables. The model used sampled first round series beginning in the 2008-2009 season until the 2023-2024 season, but excluded the 2013, 2019-2020, and 2021 seasons due to unusual circumstances. Some variables considered included advanced stats that came from moneypuck.com. Additionally, statistics that result in a first round series win rate of 65.0% or higher for the team with the advantage in that statistic since 2005-2006 are also shown, although not all of these statistics were used in the final regression model. Teams who have the advantage in each statistic will have their numbers highlighted in red. Below is an explanation of each statistic, as some of them are transformed statistics from multiple other statistics.
Special Teams Total (The addition of the powerplay percentage and penalty kill percentage)
Number of Wins by 3+ Goals
Goals For : Goals Against (Similar to goal differential, but instead uses the formula of GF/GA. For example, a team with 200 GF and 100 GA and another team with 300 GF and 200 GA have the same differential of +100, but their GF:GA is 2.0 and 1.5 respectively)
Times Outshooting Opponent (Number of games a team outshot their opponent)
Road Points (The number of points a team collected on the road in a season)
Regulation Losses Against Own Conference (The lower number is better for this statistic)
Regulation Losses Trailing After Two Periods (The lower number is better for this statistic)
High Danger Expected Goals Against (The lower number is better for this statistic)
Expected Goals For Percentage in All Situations (Expected goals for/(Expected Goals For + Expected Goals Against))